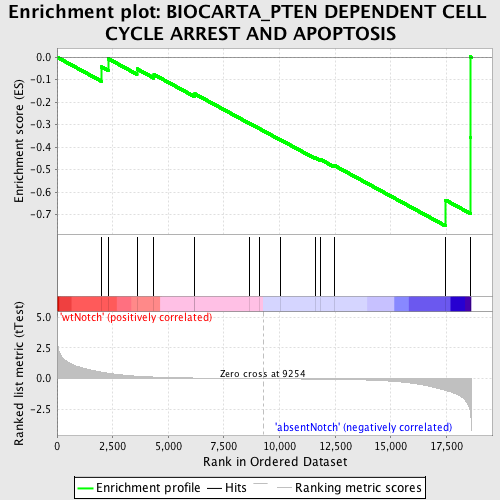
Profile of the Running ES Score & Positions of GeneSet Members on the Rank Ordered List
| Dataset | Set_03_absentNotch_versus_wtNotch.phenotype_absentNotch_versus_wtNotch.cls #wtNotch_versus_absentNotch |
| Phenotype | phenotype_absentNotch_versus_wtNotch.cls#wtNotch_versus_absentNotch |
| Upregulated in class | absentNotch |
| GeneSet | BIOCARTA_PTEN DEPENDENT CELL CYCLE ARREST AND APOPTOSIS |
| Enrichment Score (ES) | -0.75036234 |
| Normalized Enrichment Score (NES) | -1.5025812 |
| Nominal p-value | 0.024528302 |
| FDR q-value | 0.65422726 |
| FWER p-Value | 1.0 |
| PROBE | DESCRIPTION (from dataset) | GENE SYMBOL | GENE_TITLE | RANK IN GENE LIST | RANK METRIC SCORE | RUNNING ES | CORE ENRICHMENT | |
|---|---|---|---|---|---|---|---|---|
| 1 | CDKN1B | 3800025 6450044 | 1990 | 0.533 | -0.0431 | No | ||
| 2 | ILK | 870601 4480180 | 2299 | 0.442 | -0.0067 | No | ||
| 3 | SOS1 | 7050338 | 3591 | 0.201 | -0.0521 | No | ||
| 4 | PTEN | 3390064 | 4353 | 0.132 | -0.0772 | No | ||
| 5 | PDK2 | 2690017 | 6167 | 0.054 | -0.1682 | No | ||
| 6 | PIK3CA | 6220129 | 6193 | 0.053 | -0.1632 | No | ||
| 7 | PIK3R1 | 4730671 | 8630 | 0.008 | -0.2931 | No | ||
| 8 | AKT1 | 5290746 | 9115 | 0.002 | -0.3189 | No | ||
| 9 | FASLG | 2810044 | 10047 | -0.011 | -0.3676 | No | ||
| 10 | SHC1 | 2900731 3170504 6520537 | 11609 | -0.036 | -0.4472 | No | ||
| 11 | BCAR1 | 1340215 | 11859 | -0.041 | -0.4557 | No | ||
| 12 | FOXO3 | 2510484 4480451 | 12453 | -0.054 | -0.4811 | No | ||
| 13 | GRB2 | 6650398 | 17463 | -0.960 | -0.6354 | Yes | ||
| 14 | ITGB1 | 5080156 6270528 | 18580 | -2.818 | -0.3579 | Yes | ||
| 15 | PTK2 | 1780148 | 18588 | -3.004 | 0.0015 | Yes |

